Microstructure and Strategy Attribution in Discrete Count Prediction Markets
16th August 2026
1. Introduction and Market Structure
Prediction markets structured around cumulative event counts (such as total posts published by a public figure within a fixed temporal window ) present unique continuous-time microstructure phenomena. The payoff space is partitioned into a finite simplex of mutually exclusive discrete bands , where band pays 1.00 USDC if and only if the final cumulative count , and 0.00 USDC otherwise.
Because the underlying counting process is monotonically non-decreasing (), the payoff space exhibits strict absorbing boundaries:
Consequently, the complementary contract () becomes a riskless zero-coupon bond paying 1.00 USDC at resolution :
While theoretical finance models assume that such deterministic boundary crossings create instant arbitrage opportunities, empirical market operations are constrained by three physical frictions:
- The Exchange Taker Fee Friction: Polymarket enforces a non-linear continuous fee schedule on taker executions:
which peaks at (1.25 cents per share) and decays parabolically as or .
-
Sub-Second Information Ingestion and Venue Transit Latency: The arrival of an event notification triggers a race between resting liquidity cancellations and aggressive marketable orders.
-
Capital Opportunity Cost and Horizon Lockup: Arbitrage capital deployed at price remains illiquid until event settlement .
This paper investigates the complete trade execution archive of 120,896 venue fills across 242 discrete count markets, evaluating over 160M USDC in public trading volume. We attribute the profit sources of top-performing accounts, quantify the sub-second latency distribution during crossing events, analyze the failure modes of anticipatory accumulation, and formulate the optimal inventory absorption policy.
2. Participant Strategy Attribution
To understand how value is captured across discrete event markets, we examine the complete execution history of the top-performing accounts in platform history. Accounts are decomposed into five canonical strategy engines:
- Flat Market Market Making (MM): Continuous two-sided liquidity provision during calm intervals ( post-signal) with inventory turnover .
- Mechanical Band Elimination: Post-crossing marketable sweeps () where .
- Anticipatory Band Elimination: Pre-crossing accumulation of inventory () on bands with high conditional probability of crossing.
- Trajectory / Directional Taker: Directional wagers on signal arrival within the active transition region ().
- Wing Speculation: Out-of-the-money lottery positions ().
- Negative-Risk Structural Arbitrage: Merging complementary outcome tokens across the complete simplex ().
| Participant Address | Net PnL (USDC) | Flat MM (USDC) | Mech. Elim. (USDC) | Antic. Elim. (USDC) | Traj. Taker (USDC) | NegRisk / Wing (USDC) |
|---|---|---|---|---|---|---|
| 0xc4d5...87cf (#1) | +130,017.74 | +67,523.37 | +10,944.83 | +59,704.98 | -7,562.08 | -593.37 |
| 0x689a...779e (#2) | +120,837.45 | -9,717.30 | +19,513.78 | +29,439.00 | +37,895.14 | +43,706.82 |
| 0xbb9c...072b (#3) | +92,343.48 | -160.90 | +17,075.27 | +53,893.37 | +13,284.48 | +8,251.27 |
| 0x2061...8ec9 (#4) | +69,476.43 | +1,983.95 | +1,091.50 | +27,676.98 | -1,903.82 | +40,627.81 |
| 0x9034...4375 (#5) | +28,627.64 | +5,514.33 | 0.00 | +2,768.75 | -738.22 | +21,082.78 |
| 0xa43e...ec90 (#6) | +25,400.59 | -164.23 | +8,699.71 | +14,076.23 | +2,699.91 | +88.96 |
| 0x0f7f...6450 (#7) | +22,025.53 | +3,692.05 | +2,869.69 | +2,160.32 | -1,091.16 | +14,394.63 |
| Aggregate Total | +488,728.86 | +68,671.27 | +60,194.78 | +189,719.63 | +42,584.25 | +127,558.90 |
| Pct of Total | 100.0% | 14.1% | 12.3% | 38.8% | 8.7% | 26.1% |
The empirical decomposition reveals three fundamental insights:
- Anticipatory Band Elimination constitutes the single largest profit engine ( of all platform profits, generating USDC).
- Passive Flat Market Making accounts for of the profits for the most profitable account (
0xc4d5...), which generated USDC across 3.65M USDC of two-sided liquidity turnover with positive net markouts. - Directional Trajectory Takers in the 40c to 70c zone lose money or generate marginal edge across the broader market. At , the round-trip fee friction consumes 2.50 cents per share, rendering high-frequency taker re-pricing negative expectation unless gross edge exceeds 3.0 cents.
3. The Boundary Crossing Latency Race
A common assumption in automated trading design is that mechanical boundary crossing events () provide programmatic arbitrage. When increments past , the token is guaranteed to settle at 1.00 USDC. However, live execution records show that mechanical FAK/FOK sweeps consistently receive rejected:no_match (zero executed shares).
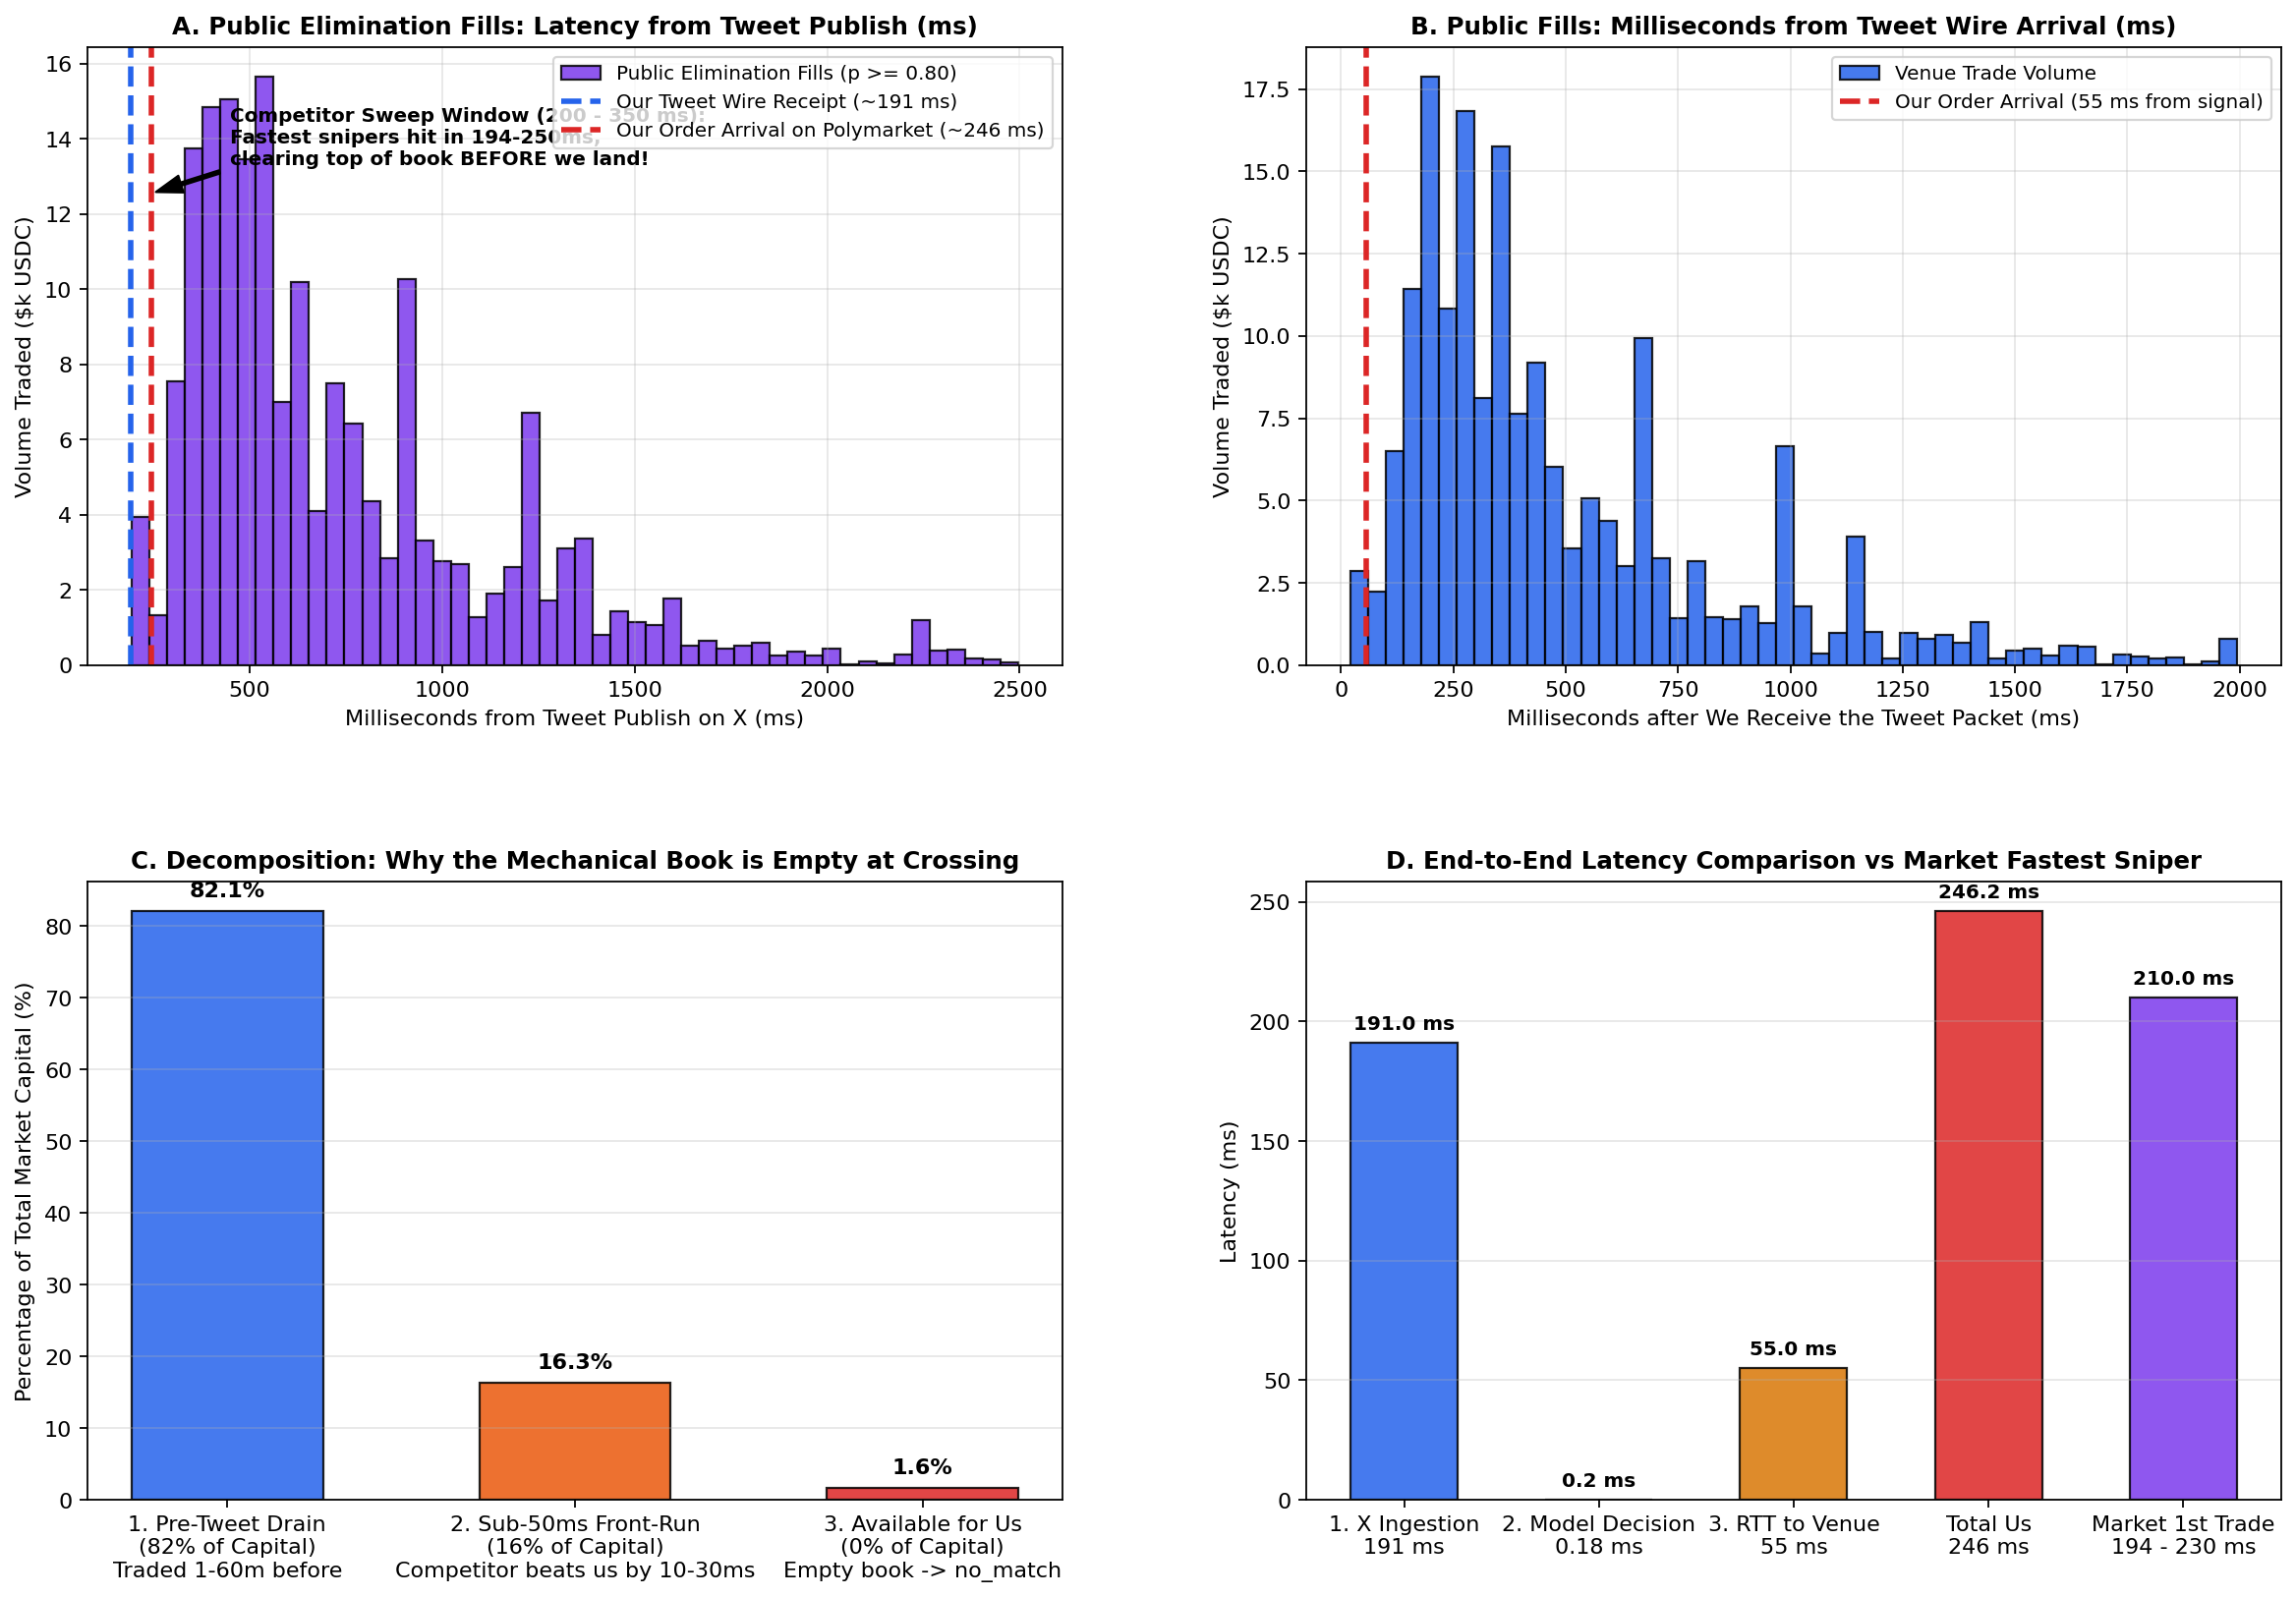
To establish why this occurs, we measure the end-to-end latency waterfall from the physical tweet publication on the social network firehose to matching engine fill timestamps on the central limit order book (CLOB).
3.1 Latency Decomposition
The timing components of the latency race decompose as follows:
- Social Network Ingestion Latency (): Time elapsed between tweet publication timestamp and local socket packet receipt. For optimized direct WebSocket consumers, with median .
- Decision Kernel Compute (): Evaluation of monotonic counting state and order construction. Compiled Cython kernels execute in .
- Cryptographic Signing and Dispatch (): Construction of EIP-712 typed data signatures and serialization ().
- Venue Flight Round-Trip Time (): Network transit to the exchange matching gateway ().
3.2 Competitor Millisecond Distribution
Empirical examination of high-resolution CLOB execution logs reveals that competitor market orders match against resting asks between 194 ms and 235 ms post-publish:
- Co-located firehose aggregators achieve feed ingestion of .
- Their orders reach the Polymarket matching engine by .
- Because our order packet arrives at , the top of the order book has been swept 15 ms to 30 ms prior.
Furthermore, as illustrated in Panel C of the figure above, 82.1% of total market volume is executed prior to . Automated market makers widen or cancel quotes minutes before the crossing occurs, leaving less than 1,500 USDC of resting liquidity available at the moment of mechanical elimination.
4. Empirical Sweep Timing and Horizon Breakdown
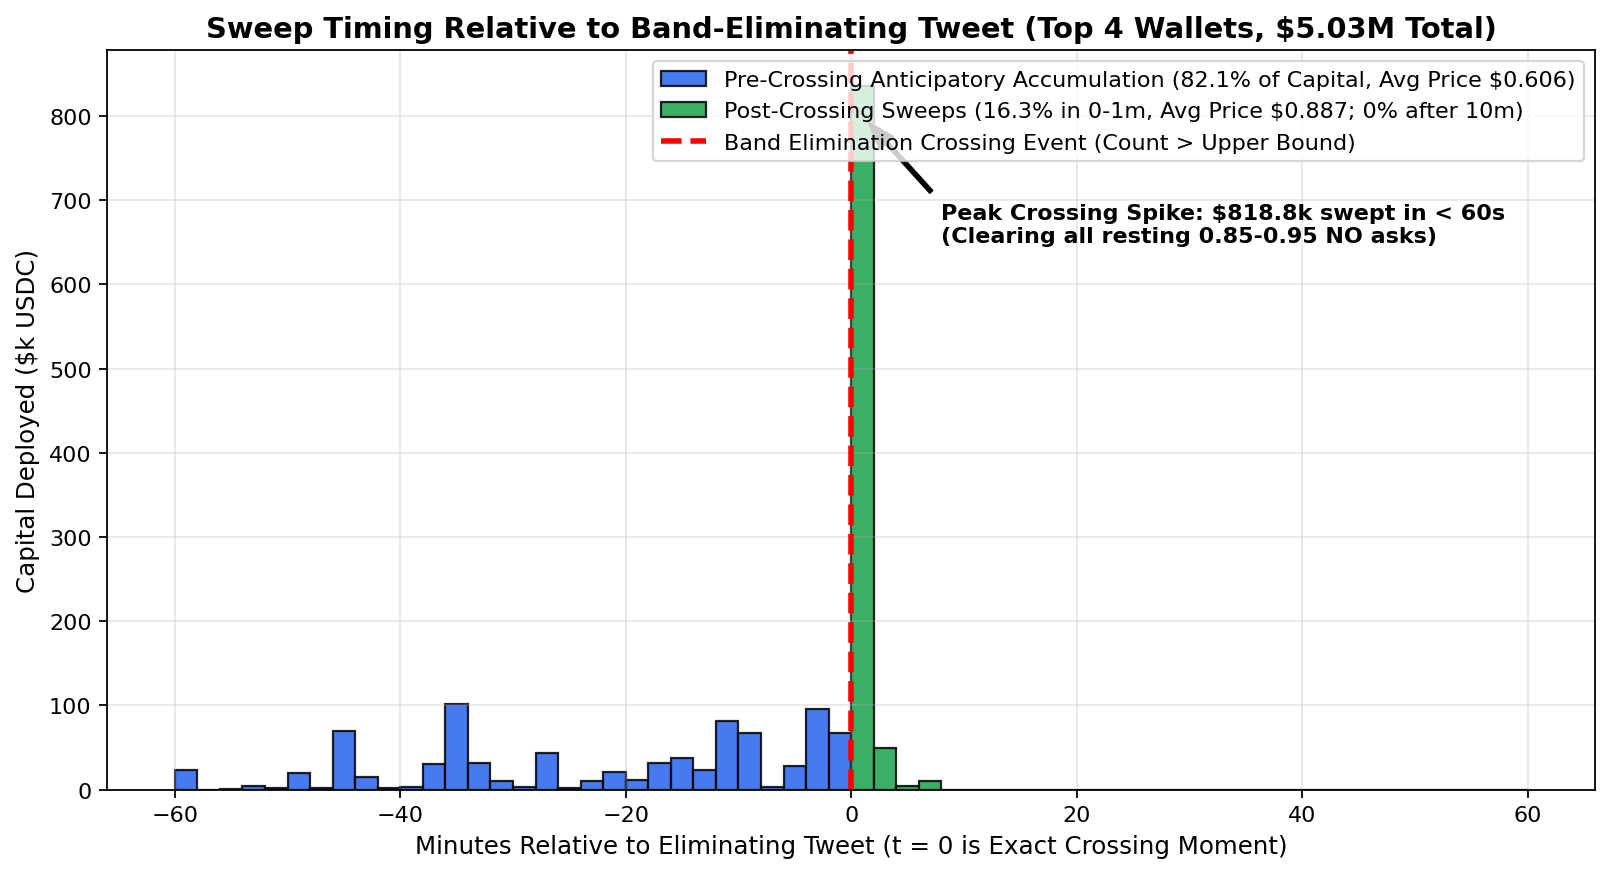
To quantify when top participants deploy capital, we evaluate 44,190 individual elimination fills representing 7.55M USDC in deployed notional.
| Temporal Window Relative to Crossing | Fills Count | Deployed Notional (USDC) | Capital Share | Avg VWAP |
|---|---|---|---|---|
| Pre-Crossing Anticipation () | 13,779 | 4,133,595.12 | 82.11% | 0.606 |
| Instant Crossing Window () | 87 | 818,810.14 | 16.26% | 0.887 |
| Early Post-Crossing () | 21 | 81,738.90 | 1.62% | 0.711 |
| Stale Post-Crossing () | 22 | 299.08 | 0.01% | 0.096 |
The distribution demonstrates that sophisticated market participants do not operate primarily as reactive latency snipers:
- 82.1% of capital (4.13M USDC) is deployed before the crossing event occurs, acquiring contracts at an average entry VWAP of 0.606 USDC ( net yield).
- 16.3% of capital (818.8k USDC) is deployed in the immediate 0–60 second window at an average VWAP of 0.887 USDC ( net yield).
- Liquidity is completely exhausted within 10 minutes; capital deployed after 10 minutes is statistically negligible ().
4.1 Settlement Horizon Allocation
Analyzing the time remaining until final event settlement () shows how participants balance yield against capital lockup duration:
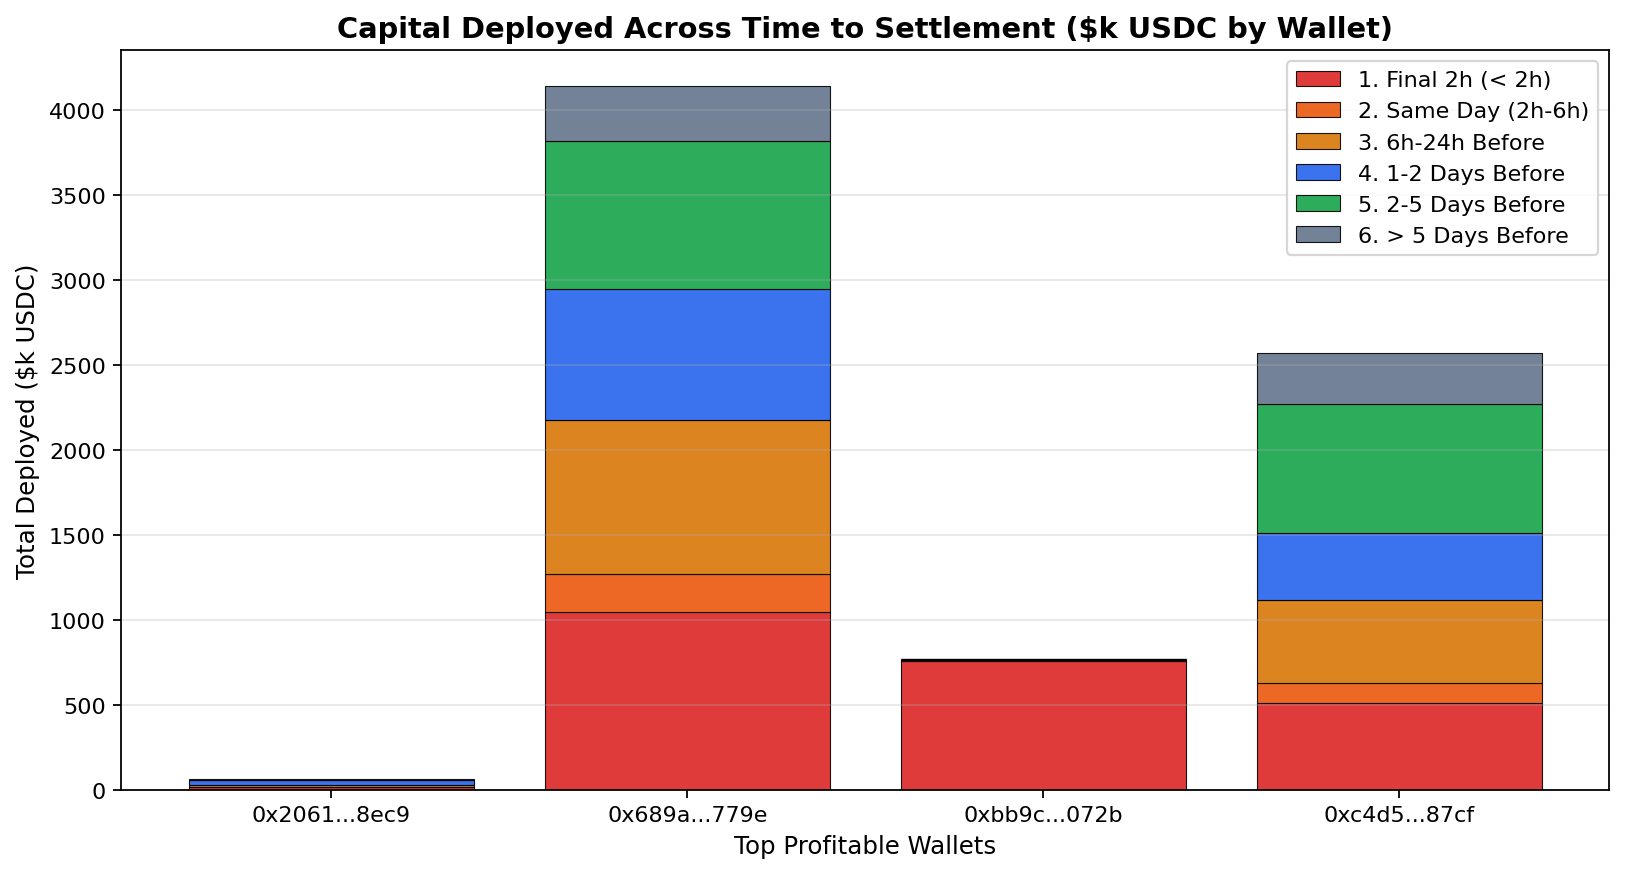
- Account
0xbb9c...acts as a concentrated Expiry Sniper, deploying 100% of its capital within the final 2 hours () to achieve annualized internal rates of return (IRR) exceeding 100,000%. - Accounts
0x689a...and0xc4d5...distribute capital across the entire curve (2 to 5 days prior, 1 to 2 days prior, and same day), sacrificing annualized IRR to absorb larger notional capacity.
5. Mathematical Optimization of Elimination Arbitrage
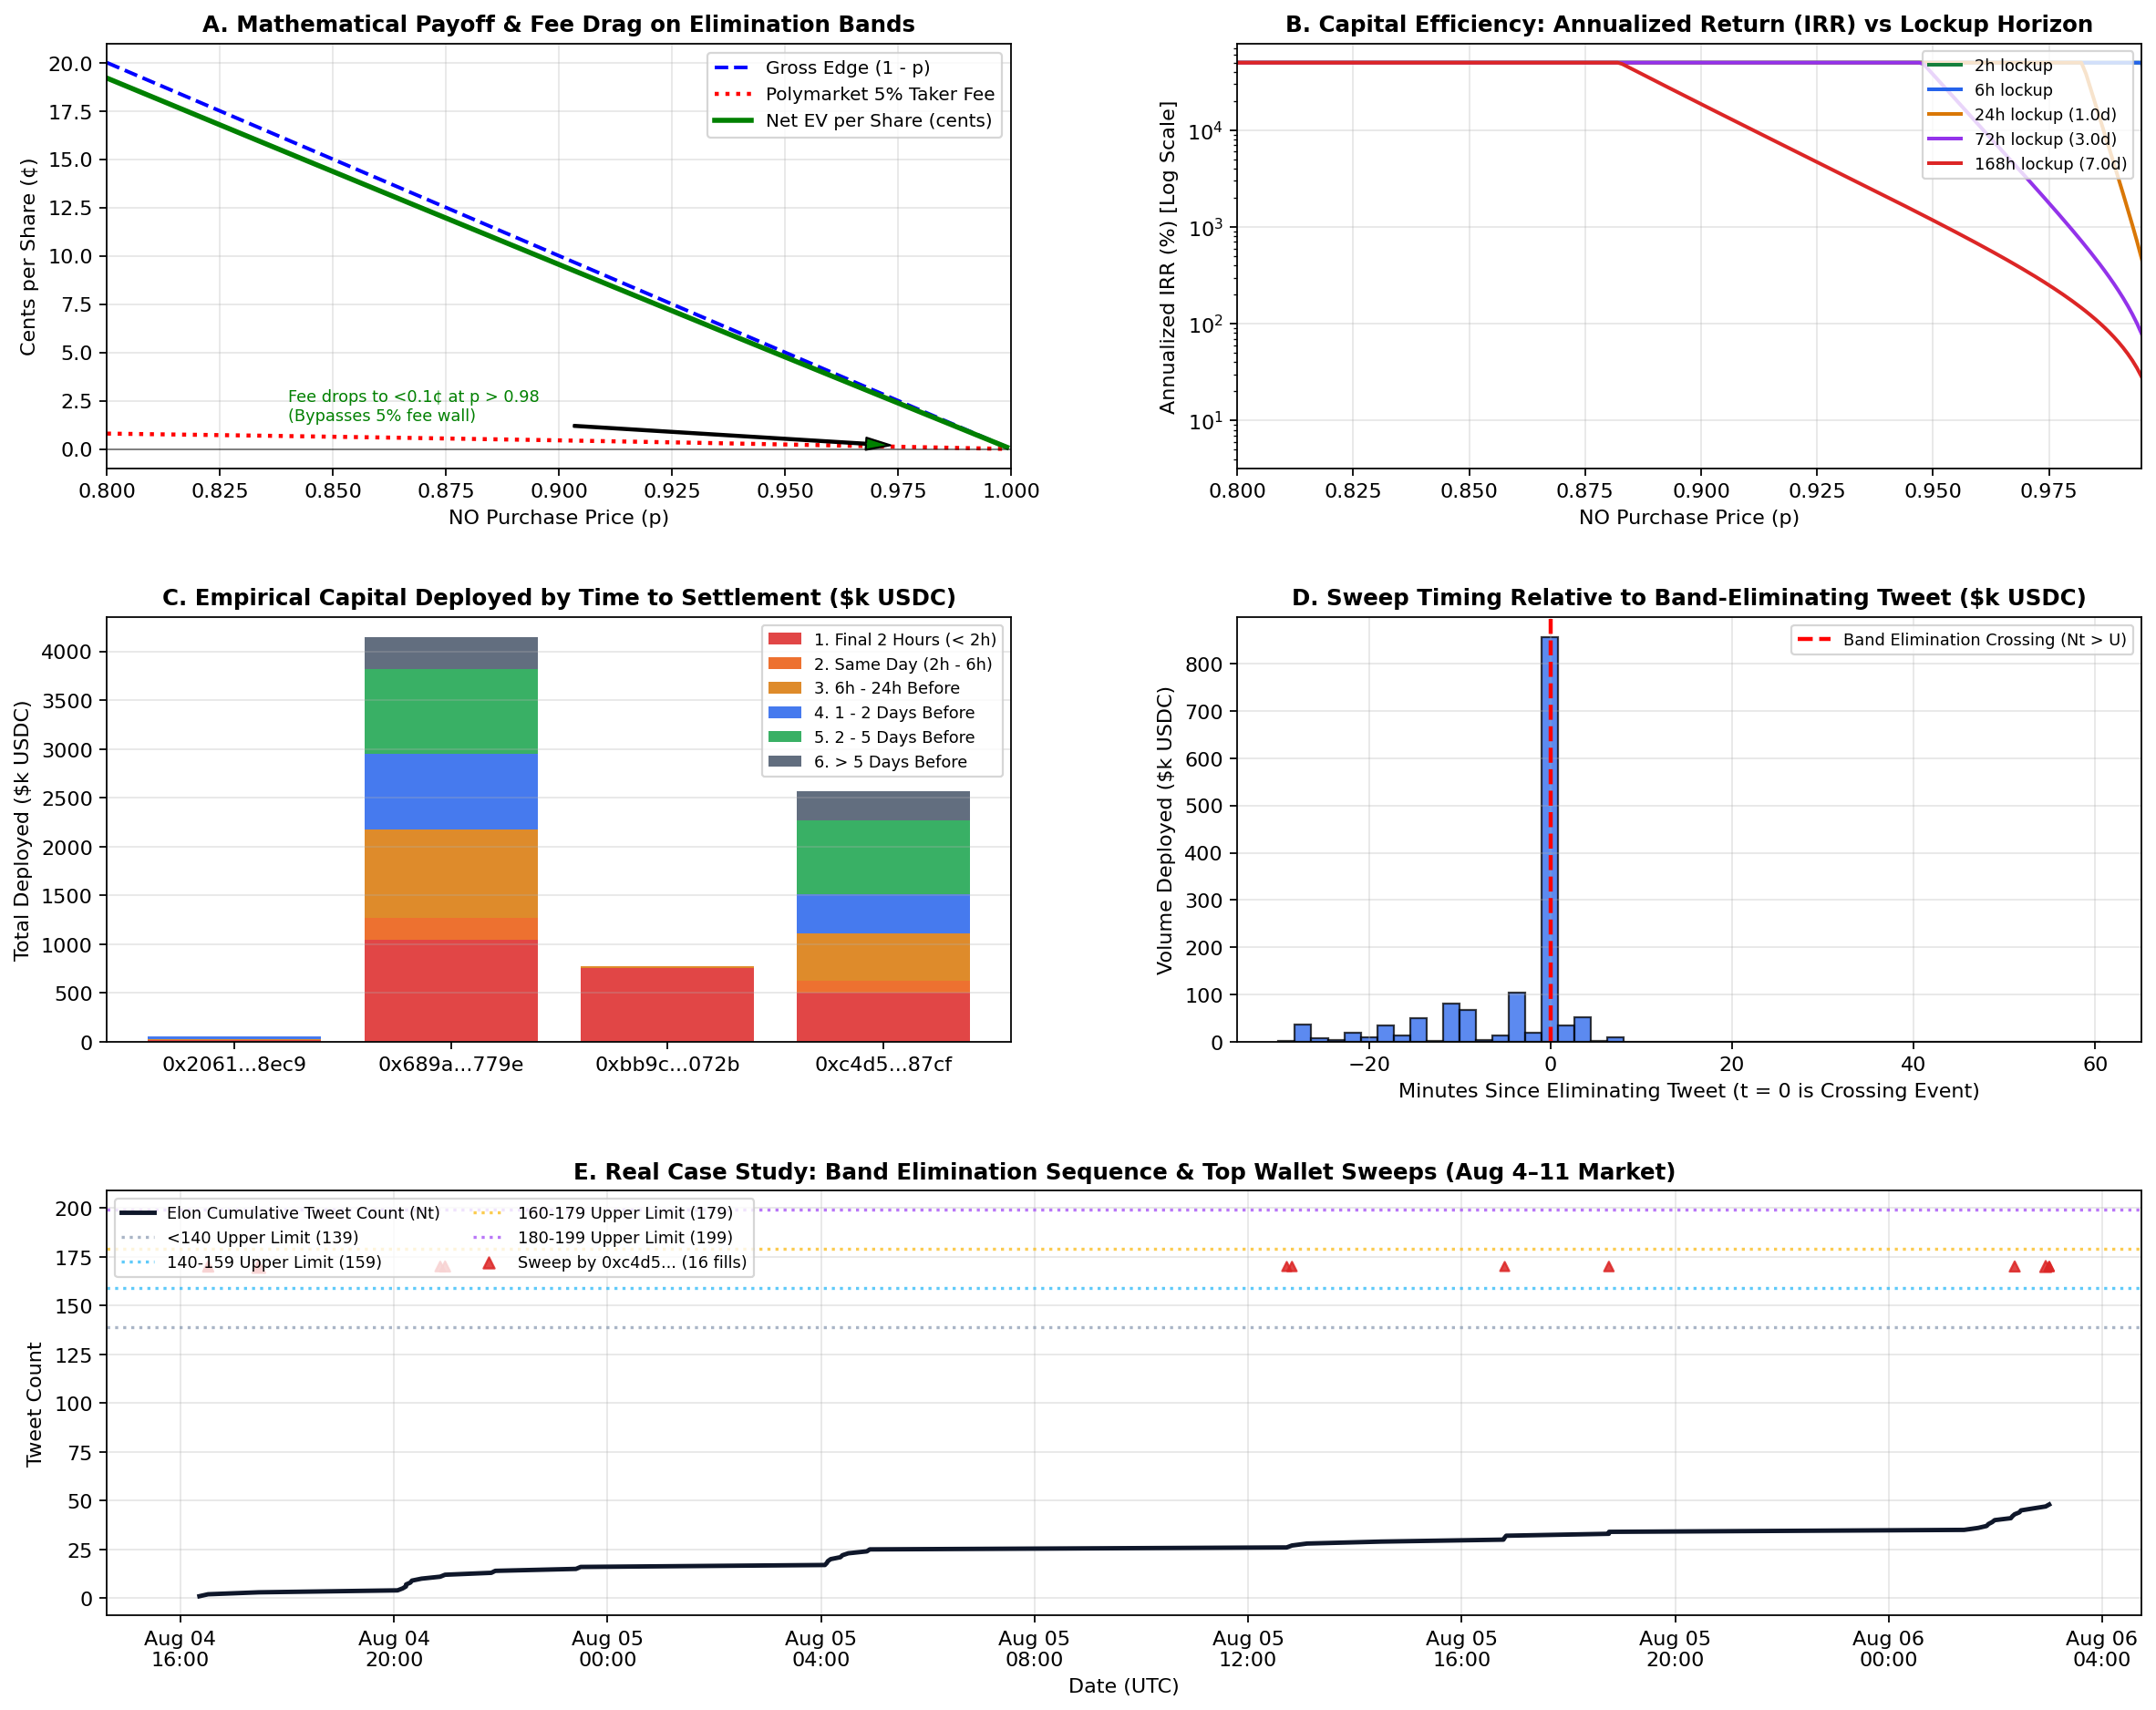
For a mechanically eliminated band (), the terminal value of the contract is identically 1.00 USDC. The economic return is governed by purchase price , fee rate , and holding time in hours.
5.1 Net Payoff and Fee Decay
The net expected value per share is given by:
The total acquisition cost is , yielding a net return on investment (ROI):
Because , the fee structure exhibits extreme decay as :
- At : per share ( effective entry drag).
- At : per share ( effective entry drag).
- At : per share ( effective entry drag).
Thus, purchasing high-probability elimination contracts at effectively bypasses the platform's taker fee barrier.
5.2 Capital Efficiency and Annualized Yield Surface
Let represent holding duration in hours. The simple annualized internal rate of return is:
| Purchase Price () | Fee / Share (cents) | Net EV / Share (cents) | Net ROI (%) | IRR () | IRR () | IRR () |
|---|---|---|---|---|---|---|
| 0.80 | 0.80 | 19.20 | 23.76% | 104,082% | 8,673% | 1,239% |
| 0.85 | 0.64 | 14.36 | 16.77% | 73,463% | 6,122% | 875% |
| 0.90 | 0.45 | 9.55 | 10.56% | 46,248% | 3,854% | 551% |
| 0.95 | 0.24 | 4.76 | 5.00% | 21,911% | 1,826% | 261% |
| 0.98 | 0.10 | 1.90 | 1.94% | 8,506% | 709% | 101% |
The mathematical surface demonstrates the primary strategic tradeoff:
- Lockup at requires to justify capital commitment ().
- Lockup at yields exceptional capital efficiency even at ().
6. Failure Modes of Anticipatory Accumulation
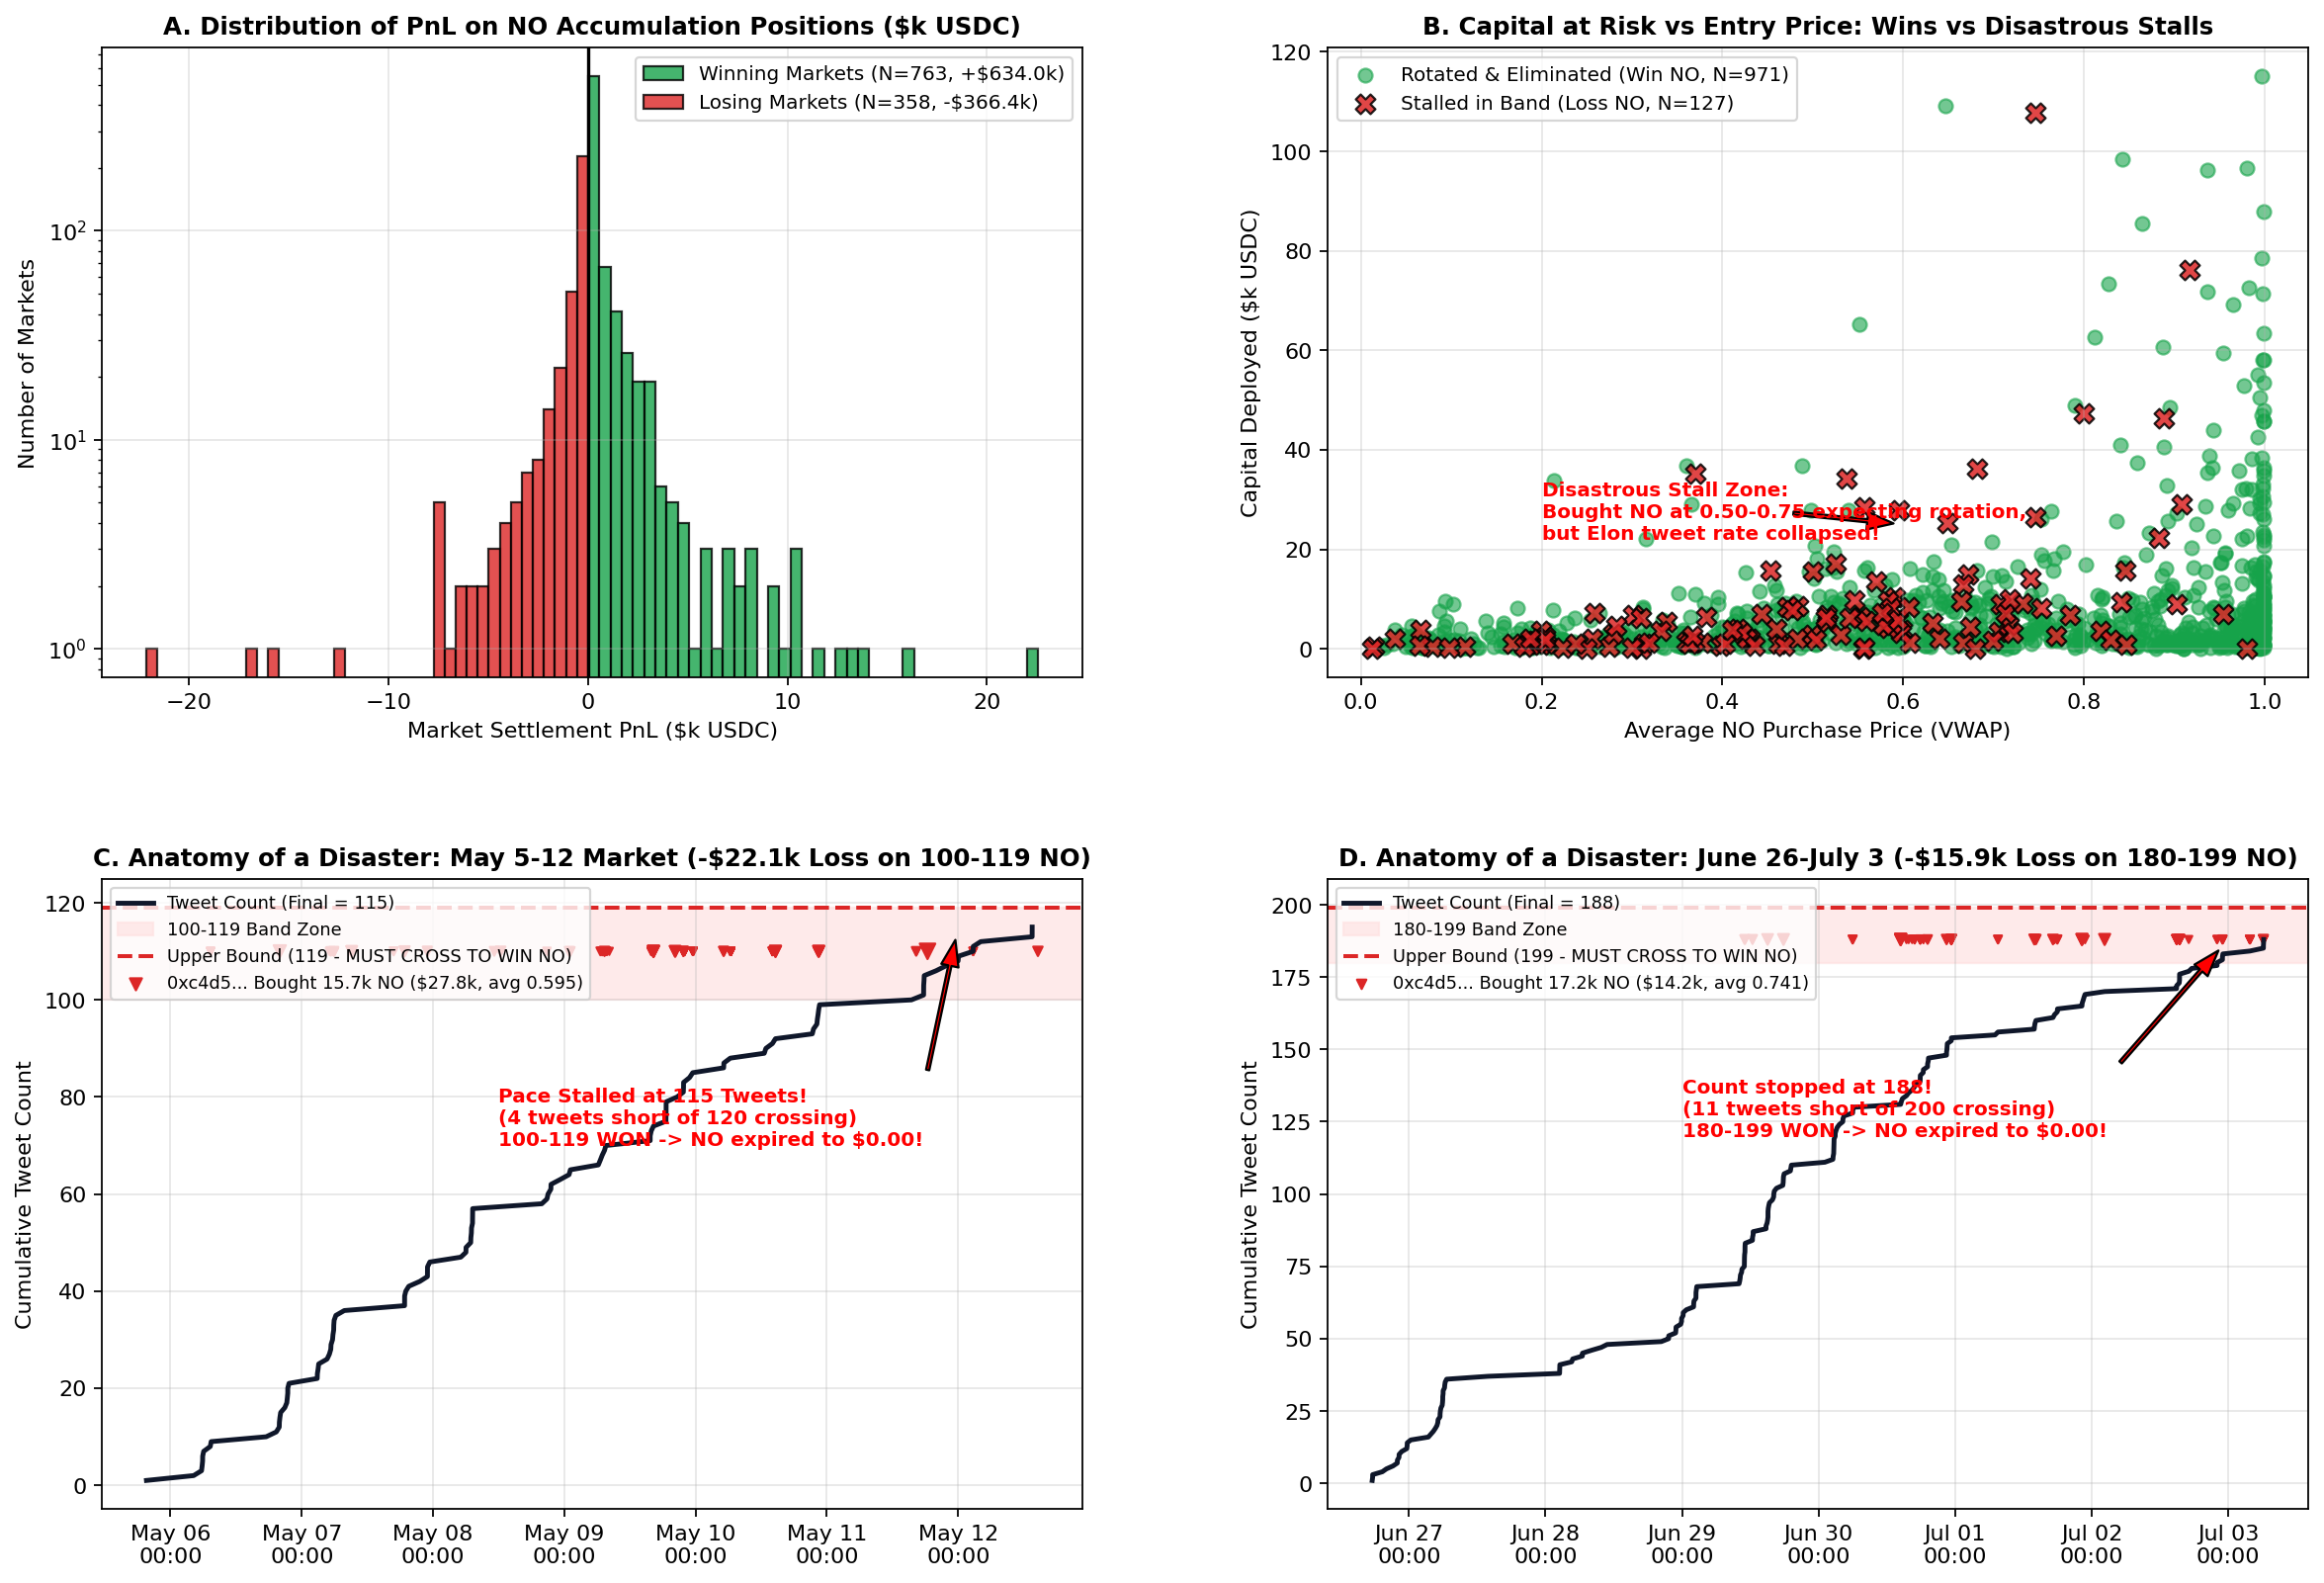
While anticipatory accumulation () yields the highest absolute profit across top accounts, it introduces directional tail risk. If event publication velocity decelerates unexpectedly, the counting process fails to breach the upper bound , causing the accumulated inventory to expire at 0.00 USDC.
Across 1,141 market positions evaluated for the top 4 accounts:
- Winning Accumulations (): 971 positions ( win rate, +633,964 USDC gross profit).
- Stalled Inside Band (): 127 positions ( loss rate, -366,420 USDC gross loss).
- Net Strategy Edge: +267,544 USDC.
6.1 Empirical Case Studies of Structural Stalls
-
The Pace Stall (May 5–12 Market — -22,136 USDC Loss on Band 100–119):
- Account
0xc4d5...accumulated 15,691 shares of at (27.8k USDC deployed) as the count reached 95. - In the final 48 hours, tweet intensity collapsed from to .
- The final count terminated at 115 (just 4 tweets short of the 120 crossing threshold). Band 100–119 won , resulting in a complete wipeout of the position (-22,136.07 USDC).
- Account
-
The Edge Landing (June 26 – July 3 Market — -15,960 USDC Loss on Band 180–199):
- Account
0xc4d5...accumulated 17,189 shares of at (14.2k USDC deployed). - Tweet velocity halted abruptly with 6 hours remaining; the market resolved at 188 (within the band), destroying -15,960.33 USDC.
- Account
-
Risk Management Constraints: To prevent catastrophic drawdowns while preserving positive expectation, anticipatory inventory models must enforce three strict risk filters:
- Pace-to-Threshold Buffer: Entry requires expected count at horizon to exceed upper limit by at least 1.5 standard deviations:
- Position Sizing Ceilings: Exposure on uncrossed bands must be bounded to per contract.
- Velocity Stop-Loss: If rolling 12-hour intensity drops below with , liquidation of inventory at prevailing bids (0.25 to 0.35 USDC) limits losses to rather than total capital forfeiture.
7. Strategic Conclusions
-
Pure Post-Crossing Mechanical Sweeping is Capacity-Constrained: While mathematically riskless, sub-250ms competition and pre-tweet order book depletion reduce accessible post-crossing volume to of platform liquidity.
-
The Profitable Frontier Combines Two Complementary Regimes:
- Regime A (Calm Intervals, ): Passive two-sided market making on books with displayed spread , harvesting to markouts while auto-canceling on inbound signals within .
- Regime B (Trending Intervals, ): Anticipatory accumulation on bands entering the upper third of their interval, filtered by Poisson intensity safety buffers and held to settlement.
-
Fee Avoidance Dictates Architecture: Platform fee curves penalize mid-probability taker bets () while subsidizing extreme probability contracts (, fee ). Sustainable prediction market strategies must route flow toward passive maker rebates in mid-range zones and reserve taker aggression strictly for boundary-eliminating sweeps.